A practical proactive IT monitoring setup delivers earlier detection, fewer noise alerts, and measurable uptime improvements — and you can reach that state in 90 days with the right staged approach. Follow a phased 30/60/90 roadmap that delivers unified telemetry, baseline-based alerts, and selective automation to move your team from reactive firefighting to proactive operations.
Start here — your immediate next steps:
After your 30-day sprint, you face a clear decision: continue the self-managed rollout with your existing team, or engage a managed NOC for 24/7 operations. NetFusion Designs Inc, a SOC 2 Type II–certified managed IT provider, is one option for that second path. The sections below walk through every step in detail, from defining SLOs to running a tuning sprint to building runbooks.
Pro Tip: *Map your SLOs to business outcomes before you touch a single agent.
A practical proactive IT monitoring setup requires a staged 30/60/90 roadmap that sequences inventory, baselining, alert tiering, and automation in the right order — skipping any step creates the alert fatigue that causes programmes to fail.
| Point | Details |
|---|---|
| Inventory before alerting | Complete asset inventory and reach 98% agent coverage before setting any thresholds. |
| Baseline before tuning | Collect at least one week of normal data; allow ML models 2–6 weeks to stabilise before routing to paging. |
| SLO-driven alert tiers | Define three tiers (Notify, Ticket, Page) tied to SLO burn rates, not static infrastructure thresholds. |
| Automate recurring incidents | Automate any remediation that has appeared three or more times; start with disk cleanup, service restart, and certificate renewal. |
| NetFusion Designs Inc | Provides managed 24/7 NOC monitoring with SOC 2 Type II certification for teams that need coverage without adding headcount. |
Proactive monitoring watches for deviations from learned baselines across metrics, logs, traces, and flows, combining cross-signal correlation and topology mapping to surface issues before users are affected. Reactive monitoring, by contrast, waits for a threshold breach or a user complaint before triggering any response. The difference is not just technical — it is a cultural shift away from firefighting toward continuous situational awareness.
UptimeBolt describes the shift well: proactive monitoring detects subtle trends and variability — jitter, slow resource growth, atypical traffic patterns — that often precede outages by hours or days. Reactive tools catch the fire; proactive tools catch the smoke.
| Dimension | Reactive monitoring | Proactive monitoring |
|---|---|---|
| Goal | Restore service after failure | Prevent failure before user impact |
| Trigger | Threshold breach or user report | Deviation from learned baseline |
| Typical detection window | Minutes to hours after impact | Minutes to hours before impact |
| Staffing expectation | On-call response team | Continuous telemetry pipeline + tuned alerts |
| Automation role | Post-incident runbooks | Pre-incident remediation and enrichment |
Proactive monitoring sits between reactive alerting and fully predictive monitoring. Predictive monitoring uses ML models to forecast future states (e.g., disk full in 72 hours). Proactive monitoring uses those same signals to alert on current anomalies before they become incidents. Both feed into incident response, but proactive is the practical entry point for most IT teams.
Key capabilities that separate proactive platforms:
The business case for proactive monitoring is straightforward. Fewer unplanned outages mean lower revenue loss, fewer SLA penalties, and more predictable IT budgets. Industry data from CorCystems shows that organisations adopting proactive monitoring report large reductions in outages and faster resolution times compared to reactive-only approaches.
Business outcomes IT managers and executives care about:
For IT teams, the operational gains are just as significant. Alert fatigue drops when thresholds are tuned to baselines rather than set to vendor defaults. Runbooks become clearer because the monitoring system enriches incidents with context before a human sees them. Root cause analysis that once took hours shrinks to minutes when metrics, logs, and traces are correlated in a single view.
There is also a compliance dimension. Proactive monitoring generates the continuous audit trail that SOC 2 Type II, ISO 27001, and similar frameworks require. Log retention policies, access controls on monitoring data, and documented incident response workflows all feed directly into audit evidence.
Instrumentation scope is where many teams go wrong — they monitor everything at once and end up with thousands of noisy alerts. A layered approach, starting with business-critical services, keeps the signal-to-noise ratio manageable from day one.
Signals by layer:
Pro Tip: Instrument your payment flows, authentication endpoints, and core APIs first. These are the services where a 5-minute outage has a direct revenue or compliance impact. Everything else can wait until week two.
Linking signals to SLOs gives every alert a business justification. When a page fires at 2 AM, the on-call engineer knows immediately whether the SLO is burning fast enough to warrant waking up a service owner.
Platform selection depends on your team size, existing tooling, and whether you need on-premises data residency. The four main categories each carry different trade-offs.
Agent-based RMM platforms (Remote Monitoring and Management) are the standard entry point for SMBs. They deploy lightweight agents to endpoints, collect metrics and patch status, and surface alerts through a centralised console. Operational effort is moderate; ML capability is limited. Paessler PRTG is a well-known example in this category, offering agentless and agent-based monitoring with a sensor-based licensing model that scales predictably for mid-sized environments.
Metrics-plus-pipeline stacks (Prometheus, Grafana, OpenTelemetry) give engineering teams full control over telemetry collection, storage, and visualisation. They support all four signal types and integrate with virtually any ITSM or alerting tool. The trade-off is operational overhead: someone on your team owns the pipeline, the storage backend, and the dashboards. Building a RED dashboard (Rate, Errors, Duration) per service is the recommended starting point, combined with consistent resource labels so metrics, logs, and traces can be correlated for fast root cause analysis.
SaaS APM and observability platforms handle the infrastructure so your team focuses on instrumentation and alerting. They typically offer built-in ML anomaly detection, distributed tracing, and pre-built integrations with cloud providers and ITSM tools. Last9 sits in this category, offering a Prometheus-compatible SaaS observability platform with cardinality management built in — useful for teams that have hit scaling limits with self-managed Prometheus.
Unified observability platforms combine metrics, logs, traces, and flows in a single data store with a shared query layer. Centralising all four signal types into one platform is the foundational capability that makes cross-signal correlation fast. Motadata is one platform in this space, offering unified telemetry ingestion alongside ML-driven anomaly detection and topology-aware alerting. BigPanda takes a different angle: it sits above your existing monitoring tools as an AIOps correlation layer, reducing alert noise by grouping related signals into a single incident before a human sees them.
| Evaluation dimension | Agent-based RMM | Metrics pipeline (self-managed) | SaaS APM/observability | Unified observability platform |
|---|---|---|---|---|
| Best for | SMB endpoint coverage | Engineering-led teams | Cloud-native apps | Complex multi-layer environments |
| Deployment model | On-prem agent + cloud console | On-prem or cloud | SaaS | SaaS or on-prem |
| Signals supported | Metrics, some logs | Metrics, logs, traces | Metrics, logs, traces | Metrics, logs, traces, flows |
| ML / anomaly detection | Limited | Plugin-dependent | Built-in | Built-in |
| ITSM integrations | Moderate | Manual configuration | Strong | Strong |
| Scalability and pricing | Per-sensor or per-device | Infrastructure cost | Per host or per data volume | Per host or per data volume |
| Operational effort | Low to moderate | High | Low | Low to moderate |
Deployment decision checklist:
This roadmap follows the 10-step implementation framework from BigPanda and the phased migration approach from Motadata, adapted for IT managers running a 90-day sprint.
Owner: IT manager (inventory, SLO definition), platform engineer (agent deployment, pipeline)
Owner: Platform engineer (baselining, dashboards), IT manager (alert tier policy), service owners (runbook review) Acceptance criteria: Paging alert volume reduced to fewer than five pages per on-call shift; every paging alert linked to a runbook; RED dashboard live for all Tier 1 services.
Owner: Platform engineer (automation, ML), IT manager (SLO review, compliance), service owners (acceptance sign-off) Acceptance criteria: At least three automated remediations running in production; SLO burn-rate dashboards live; compliance log retention confirmed.
| Phase | Days | Key deliverable | Acceptance metric |
|---|---|---|---|
| Foundation | 1–30 | Full asset inventory + telemetry pipeline | 98% endpoint coverage |
| Baselining | 31–60 | Tuned alert tiers + RED dashboards | < 5 pages per on-call shift |
| Automation | 61–90 | Automated runbooks + ML anomaly detection | 3+ automations in production |
Alert fatigue is the most common reason proactive monitoring programmes stall. Teams deploy agents, leave thresholds at vendor defaults, and within a week the on-call rotation is ignoring pages. The fix is a structured baselining and tuning process, not a better tool.
Baseline data collection checklist:
ML anomaly models need more time. SolarWinds notes that these models typically require 2–6 weeks of observation per system to become reliable. Do not route ML-generated alerts to paging until the model has completed its tuning window.
Running a tuning sprint (weeks 2–4):
Assign one engineer to own the sprint. Each day, review the previous 24 hours of alerts, identify the top five noisiest rules, and either raise the threshold, add a duration filter, or suppress the rule entirely if it has never produced an actionable ticket.

Pro Tip: Use multi-window burn-rate alerting for SLO-based paging. This approach, described in detail by Omar Ghader, keeps the on-call rotation sane while ensuring slow-moving degradations don’t go unnoticed.
Alert tier examples in practice:
Detection without response is just observation. The value of proactive monitoring comes from connecting alerts to a structured incident workflow that routes the right signal to the right person with the right context already attached.
Integration checklist:
Runbook automation examples:
Safe automation criteria: Only automate a remediation when the action is reversible, the failure mode is well understood, and the automation has been tested in a non-production environment. Require human approval for any action that modifies database schemas, changes firewall rules, or affects more than one service simultaneously.
Detection-to-closure workflow:
The monitoring platform detects an anomaly and enriches the alert with topology context (which services are affected, which dependencies are involved). The enriched alert is correlated with related signals to form a single incident record. The incident is routed to the appropriate tier: automated remediation runs first; if it succeeds, the incident closes automatically with a log entry. If automation fails or the incident exceeds the automated scope, it escalates to the on-call engineer with full context already attached. The engineer resolves the incident, documents the root cause, and triggers a post-incident review if the SLO burn was significant.
Most IT environments sit at Stage 1 or 2 when they start a proactive monitoring programme. The five-stage model below gives you a clear map of where you are and what to do next.
Stage 1: Reactive baseline You respond to outages after users report them. Monitoring, if present, uses static thresholds and generates high alert volumes.
Timeframe: 2–4 weeks with one dedicated engineer.
Stage 2: Historical trend You have centralised telemetry and can look back at what happened. You are not yet alerting on trends. Highest-leverage action: Build RED dashboards per service and run your first baseline collection sprint. Timeframe: 4–6 weeks; requires a platform engineer.
Stage 3: Proactive alerting You alert on deviations from baselines before users are affected. Alert fatigue is managed through tiering and tuning. Highest-leverage action: Introduce cross-signal correlation and SLO-based burn-rate alerting. Automate your first three runbooks. Timeframe: 6–10 weeks; requires ongoing tuning ownership.
Stage 4: Predictive monitoring ML models forecast resource exhaustion and performance degradation hours or days in advance. Capacity planning is data-driven. Highest-leverage action: Enable ML anomaly detection on high-traffic services after 2–6 weeks of model training. Integrate capacity forecasts into change management. Timeframe: 3–6 months; requires ML-capable platform and dedicated model review.
Stage 5: Self-healing operations Automated remediation handles the majority of recurring incidents without human intervention. The NOC focuses on novel incidents and continuous improvement. Highest-leverage action: Expand automation coverage to all incidents that have appeared three or more times. Implement closed-loop feedback between incident data and alert tuning. Timeframe: 6–12 months; typically requires a managed NOC or a dedicated SRE team.
Most SMBs reach Stage 3 within 90 days using this guide. Stages 4 and 5 require either a larger internal team or a managed partner.
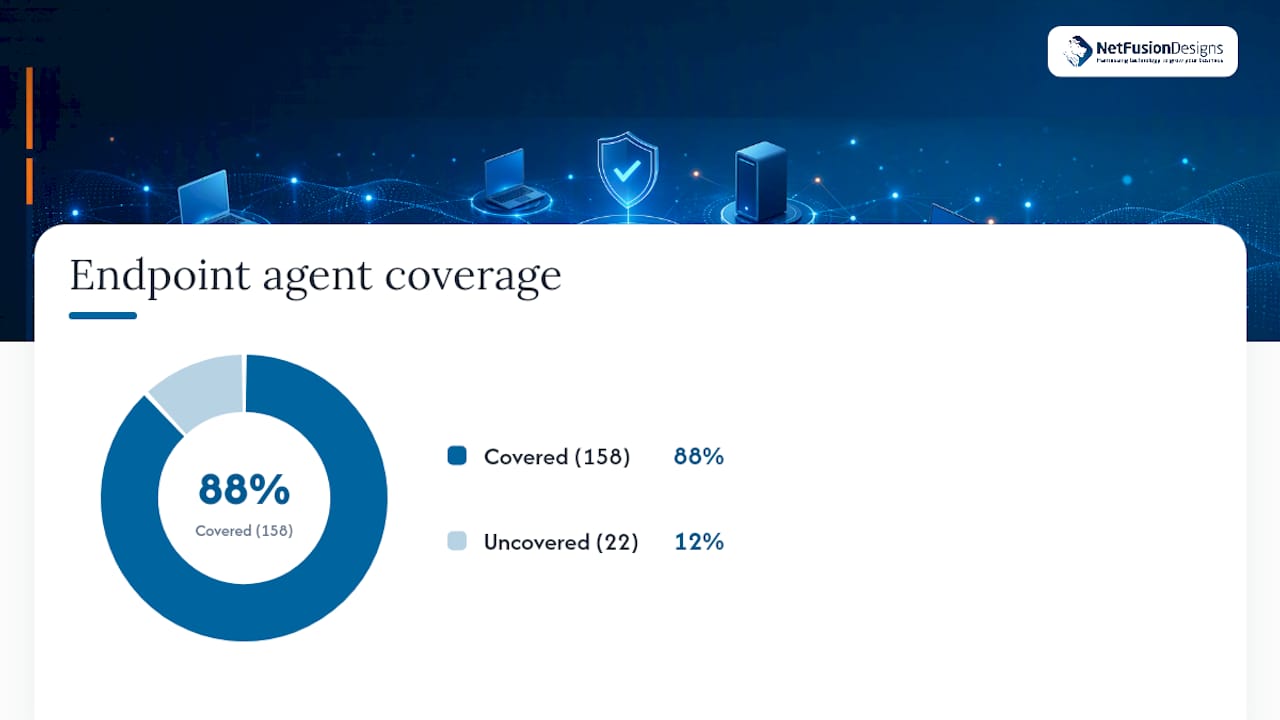
A mid-sized professional services firm with 180 endpoints and a three-person IT team came to NetFusion Designs Inc with a familiar problem: their monitoring tool was generating over 400 alerts per week, the on-call engineer was averaging four pages per night, and two P1 incidents in the previous quarter had each caused more than three hours of downtime. The team had agents deployed but no baselines, no alert tiering, and no runbooks.
NetFusion Designs Inc’s NOC team ran the following steps over a couple of months:
The outcome at day 60: zero P1 incidents, MTTR on P2 incidents reduced significantly, enabling faster resolution times, and the on-call engineer sleeping through the night. The firm also used the monitoring data as audit evidence for their SOC 2 Type II review.
The staged approach matters because it prevents the most common failure mode: deploying a powerful monitoring platform, leaving it on default settings, and burning out the on-call team within three weeks. The NOC’s value is not just the tooling — it is the operational discipline to baseline before alerting, tune before automating, and measure outcomes at every checkpoint.
When to keep it self-managed vs. engage a managed NOC:
Do not do these:
Best practices that make the difference long-term:
Security and compliance considerations:
Log retention policies must align with your compliance framework before you go live. SOC 2 Type II typically requires 12 months of log retention; some regulated industries require longer. Access controls on monitoring dashboards should follow least-privilege principles — not every team member needs write access to alert rules. Audit who can modify thresholds and runbooks, and log those changes. If your monitoring platform ingests sensitive application data (user IDs, transaction amounts), confirm that data handling aligns with your privacy policy and applicable regulations.
For teams managing enterprise-grade security alongside monitoring, integrating security event feeds into the same telemetry pipeline gives the NOC a unified view of both performance and threat signals.
Owner: IT manager (inventory, SLO definition), platform engineer (agent deployment, pipeline)
Owner: Platform engineer (baselining, dashboards, ITSM), IT manager (alert policy), service owners (runbook review)
Owner: Platform engineer (automation, ML), IT manager (SLO review, compliance audit)
| Task | Owner | Acceptance criteria |
|---|---|---|
| Asset inventory complete | IT manager | All endpoints documented with criticality tier |
| Agent coverage | Platform engineer | 98% of fleet reporting to central platform |
| SLO register | IT manager + service owners | SLOs defined for all Tier 1 services |
| Baseline collection | Platform engineer | Minimum 1 week of data per critical service |
| Alert tuning sprint | Platform engineer | < 5 pages per on-call shift |
| RED dashboards | Platform engineer | One dashboard per Tier 1 service |
| Runbook automation | Platform engineer | 3+ automations running in production |
| Compliance audit | IT manager | Log retention confirmed; access controls documented |
Most monitoring failures happen in the first 30 days, not because the tools are wrong but because teams skip the inventory and baseline steps and go straight to alerting. The result is a flood of noise that erodes trust in the entire programme. A staged rollout — inventory first, baseline second, alert third, automate fourth — builds that trust incrementally.
Running a 24/7 NOC gives you a clear view of where self-managed teams struggle most. The tuning sprint is the single most skipped step. Teams collect baseline data, then move straight to automation without running the sprint, and the automation fires on noisy signals. The sprint is not optional; it is the step that separates a monitoring programme that works from one that gets abandoned.
The minimum viable skill set for self-managed proactive monitoring is one engineer who owns the telemetry pipeline and one IT manager who owns the SLO register. Without both roles filled, the programme drifts. If your team cannot fill both roles, a managed NOC is not a luxury — it is the faster path to Stage 3 maturity.
For teams evaluating when to bring in outside help, NetFusion Designs’ enterprise consulting covers telemetry architecture and SLO design as a discrete engagement, separate from a full managed services contract.
Your team has the roadmap. The question is whether you have the bandwidth to run it. NetFusion Designs Inc delivers fully managed proactive monitoring backed by a 24/7 NOC, SOC 2 Type II certification, and enterprise-grade tooling — without requiring you to hire, train, or retain a dedicated platform engineering team.

For SMBs and mid-market IT teams across Ontario and Canada, the practical advantage is speed: NetFusion Designs Inc can complete the asset inventory, agent deployment, and baseline collection in the time it would take an internal team to evaluate platforms. Managed monitoring plans include alert tuning, runbook automation, ITSM integration, and continuous SLO review. If an incident fires at 2 AM, the NOC handles it — and your on-call engineer stays asleep.
Start with a free IT health check to get an instant score on your current monitoring coverage and identify the highest-priority gaps. For teams that need immediate incident coverage while the rollout is underway, emergency IT support is available 24/7. Ready to move to a fully managed engagement? Explore managed IT services in Kitchener-Waterloo or contact the team directly at nfd.ca to discuss a monitoring assessment.
The following sources informed this guide and are worth bookmarking for deeper reading:
Reactive monitoring alerts after a threshold is breached or a user reports an issue. Proactive monitoring detects deviations from learned baselines before users are affected, using cross-signal correlation and topology mapping to surface issues earlier.
A practical 30/60/90-day roadmap gets most IT teams to Stage 3 maturity (proactive alerting with tuned thresholds and automated runbooks) within 90 days, assuming one dedicated platform engineer and an IT manager owning the SLO register.
Collect at least one week of baseline data before setting thresholds, run a dedicated tuning sprint in weeks 2–4, and use SLO-based burn-rate alerting rather than static infrastructure thresholds. This approach typically reduces weekly alert volume significantly while increasing the percentage of alerts that require human action.
Engage a managed NOC when your team cannot fill both a platform engineer and an IT manager role, when you need 24/7 coverage, or when a compliance framework such as SOC 2 Type II requires documented continuous monitoring. NetFusion Designs Inc offers managed monitoring with a 24/7 NOC for SMBs across Ontario and Canada.
Start with API error rate, API latency (p99), disk capacity, TLS certificate expiry, and database slow query count. These five signals cover the most common sources of user-facing incidents and map directly to SLOs you can define in the first week of your rollout.
%20(1).avif)
%201.avif)