Most organizations spend between 3% and 6% of revenue on IT, with Deloitte reporting an average near 5.5%. The right number for your business depends heavily on industry, company size, and how much you’re investing in cybersecurity or AI. We work with small and mid-sized businesses across Ontario and Canada every day, and we rarely see a single percentage that fits every organization.
TL;DR:
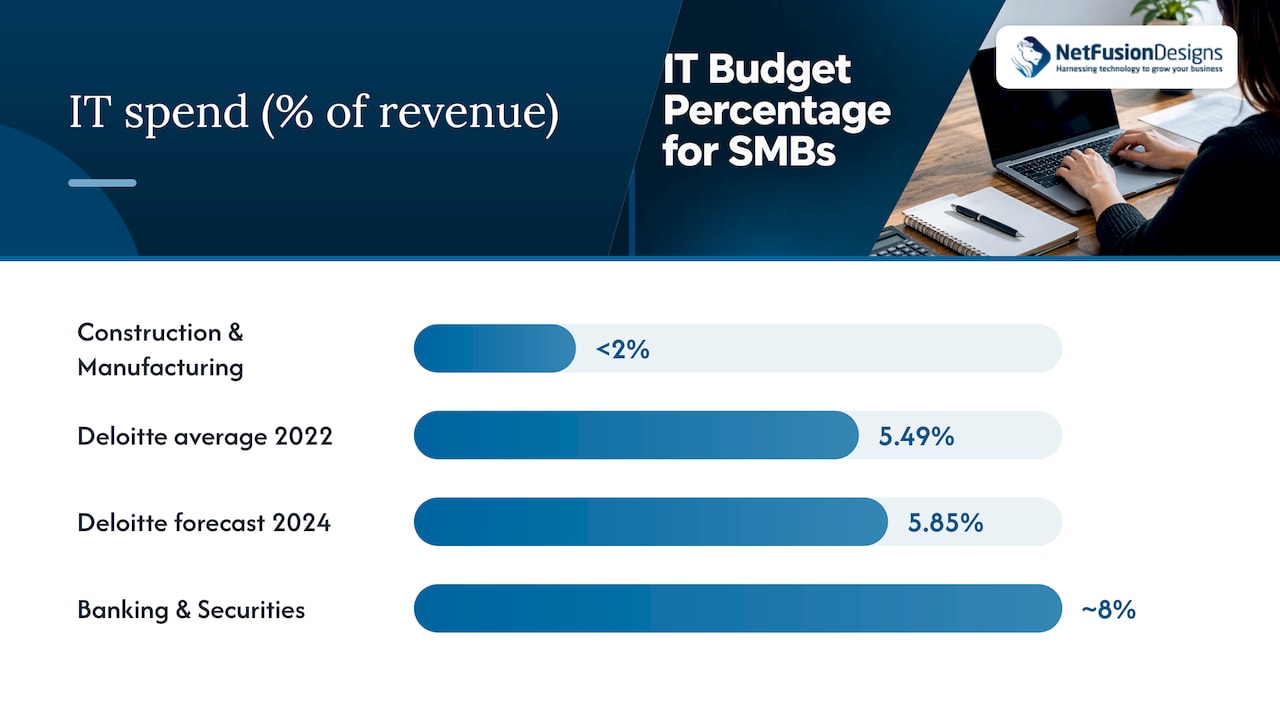
- IT budgets vary widely across industries, with banking approaching 8% of revenue while construction often spends under 2%, making a single average misleading.
- Smaller organizations typically allocate a higher percentage of revenue to IT to cover baseline security and support, despite lower absolute dollar spend, unlike larger firms with more complex systems.
- Operational costs usually consume most of the IT budget, with growth and transformation initiatives often receiving a smaller share unless specifically prioritized.
- Revisiting your IT budget is justified during rapid growth, new compliance needs, security threats, or when adopting new technologies like AI; vendor price hikes can also erode spend value.
- Common cost-saving levers include consolidating vendors, automating manual tasks, rightsizing cloud resources, and improving security to prevent costly incidents.
Deloitte’s technology research found average tech budgets at 5.49% of revenue in 2022, trending toward 5.85% by 2024. But the spread across industries is wide.
Some sectors run far above or below that midpoint:
IT spending sits between under 2% and nearly 8% of revenue depending on industry, according to Deloitte, which means a single average tells you almost nothing about whether your own spend is appropriate.
Company size introduces its own twist: the economies-of-scale paradox. Smaller organizations often spend a higher percentage of revenue just to reach baseline security and operational tooling, since fixed costs like a help desk, backups, and endpoint protection don’t shrink with headcount. Larger enterprises post a lower percentage of revenue on paper, but their absolute dollar spend per employee is usually much higher, since they carry more complex systems, larger security teams, and layered compliance obligations.
Two formulas cover most of what a finance lead needs:
Say a business with $10 million in annual revenue and 50 employees spends $450,000 a year on IT.
Before comparing numbers across years or against a peer, settle what counts as “IT spend.” Include recurring cloud subscriptions, managed services fees, hardware depreciation, and software licensing. Decide whether capital projects (new infrastructure builds, major migrations) are tracked separately from operating expenses, and stay consistent year over year, since mixing the two distorts both the percentage and the per-employee figure.
Once you know your target percentage, the harder question is where the dollars go. Practitioners typically split IT budgets into three buckets:
Operations typically absorb the largest share of an IT budget, according to Spiceworks research on IT budgets, often outweighing innovation spending by a wide margin unless leadership deliberately protects a transformation line item.
Regulated industries and digital front-runners tend to shift this split. A financial services firm facing compliance audits will push more of its budget into security and resilience, inside the “run” category. A firm racing to adopt AI-assisted workflows will protect its “transform” line even when the overall percentage stays flat, reallocating from elsewhere rather than asking for a bigger pie.
A handful of signals justify revisiting your IT percentage rather than waiting for a budget calendar to force the conversation:
One caution worth building into your planning: Gartner’s worldwide IT spending forecast projects global IT spending will grow 9.8% in 2026, surpassing $6 trillion, but warns that price inflation on software and services can absorb much of that nominal increase. A budget that grows 8% on paper might buy the same capacity as last year once vendor price hikes are factored in.
Pro Tip: Review your IT budget against actual usage quarterly, and do a full reallocation once a year, so inflation and vendor renewals don’t quietly erode your transformation spend.
Before adjusting a target percentage, most organizations find savings by tightening how the existing budget is spent:
Five levers tend to move the needle most:
Pro Tip: Run a free IT health check before your next budget cycle. It’s the fastest way to see which of these five levers will save the most for your specific environment.
We built our Managed IT Services and our SOC 2 Type II certified security operations around exactly these levers, giving clients a predictable monthly cost instead of a string of unplanned IT bills.
Faster-growing mid-market firms treat continual infrastructure investment as a competitive advantage, not a cost to minimize, according to Deloitte’s mid-market research. Cutting IT spend to the bone often shows up later as an agility gap or a security exposure nobody budgeted for.
— Geeshan
Figuring out the right percentage is easier with a clear picture of where your dollars go today. We offer a free IT health check to map your current spend against the run, grow, and transform categories, then show you where a lever like managed services or cloud rightsizing could free up budget for security or AI projects.

What we bring to that conversation:
Book an assessment to see where your IT budget percentage should actually land.
Per-employee IT spend varies widely by company size and industry, since fixed costs like security tooling and help desk support don’t scale down with headcount. A useful approach is to calculate your own figure by dividing total IT spend by headcount, then compare it against your percentage-of-revenue benchmark for context.
Smaller businesses often report a higher IT spend as a percentage of revenue because baseline costs like security and support don’t shrink with fewer employees, while larger enterprises post a lower percentage but a higher absolute dollar amount per employee, according to Deloitte’s enterprise technology research. This pattern holds across most industries studied.
Organizations commonly use several budget types, including operating, capital, cash flow, project, and departmental budgets, though the exact list varies by source and industry. For IT specifically, most practitioners simplify this into three practical buckets: running, growing, and transforming.
Small businesses often land close to or above the broader average of roughly 5% to 6% of revenue, since fixed security and support costs apply regardless of size, according to Deloitte’s benchmark research. The right figure still depends on industry and how much risk a business is willing to carry.
Most organizations benefit from a quarterly check against actual spend, paired with a full annual reallocation to account for vendor price changes and shifting priorities. This cadence catches the kind of inflation-driven budget erosion that Gartner has flagged as a growing risk for 2026 budgets.
%20(1).avif)
%201.avif)